The importance of website speed and how to set up a CrUX Dashboard
From content to web design, Google emphasises making everything user-centric – and it is no different when it comes to website speed.
Core Web Vitals is the latest tool launched by Google to improve user experience by measuring site speed metrics. It joins a collection of previously introduced tools such as Pagespeed Insights, Mobile-friendly Test, Lighthouse, and various initiatives including the Accelerated Mobile Pages (AMP) format, Chrome UX Report and website.dev.
In this article, we explore what Core Web Vitals is, why it is important for your website and how you can set up a Chrome User Experience Report (CrUX) to gain meaningful site speed insights.
What are Core Web Vitals?
Core Web Vitals (CWV) are a set of metrics that measure the user experience of a website, including loading speed, interactivity and visual stability. The Core Web Vitals metrics are considered important indicators of a website’s overall performance. Google uses them to determine the quality of a website and its ranking in search results.
What are the Core Web Vital Metrics?:
- Largest Contentful Paint (LCP): measures loading performance at the point where the bulk of visible content is shown to the user. To provide a good user experience, LCP should occur within 2.5 seconds of when the page first starts loading.
- First Input Delay (FID): estimates the delay between loading a page and interactivity (when a user can click a site function, for example, to expand a navigation menu). To provide a good user experience, pages should have an FID of fewer than 100 milliseconds.
- Cumulative Layout Shift (CLS): calculates visual stability on a scale starting at 0. For example, content loaded via JavaScript causes the page to visually ‘shift about’, which is classified as a layout shift. To provide a good user experience, pages should maintain a CLS of less than 0.1.
A page passes the Core Web Vitals assessment if the 75th percentiles of all three metrics are ‘Good’. Anything less and the page does not pass the assessment – it is categorised as ‘Need improvement’ or ‘Poor’.
Note that the metrics listed above are just Core Web Vitals. There are many other Google and third-party tools that help you to measure your digital marketing performance.
How do Core Web Vitals score impact your site?
A Core Web Vitals (CWV) score can impact a website in several ways. A website with poor CWV scores may experience:
- Lower search engine rankings. Google uses CWV to determine a website’s quality and ranking in search results. If you have poor CWV scores, competing pages with better scores will rank higher and get more traffic.
- Increase user engagement. A website with poor CWV scores may take longer to load, be less responsive or have visual elements that are constantly moving or flickering. These issues can create a negative user experience and even cause stress, leading to decreased engagement and increased bounce rates.
- Loss of revenue. A website with poor CWV scores may decrease conversions and sales, as users may be less likely to complete a purchase or form submission if they are frustrated by the website’s performance. They may even struggle to find your website in the first place if competitors rank higher.
There are many studies that show how improved site speed can optimise conversions:
- A 0.1-second improvement in mobile speed conversion increases conversion rates by 8.4% for retail sites and 10.1% for travel sites.?
- A 1-second delay in mobile can impact mobile conversions by up to 20%.?
- If a mobile site takes more than 3 seconds to load, 53% of visits are abandoned, according to Google data from 2016.?
- Brand damage: A website with poor CWV scores can reflect poorly on a brand, as users may associate the website’s poor performance with the brand itself.
So now you have learnt about Core Web Vitals, but what is a good way to visualise your metrics?
What is the CrUX Dashboard?
The Chrome User Experience Report (CrUX) is a dataset provided by Google that contains user experience metrics for millions of websites based on real users who visited them.
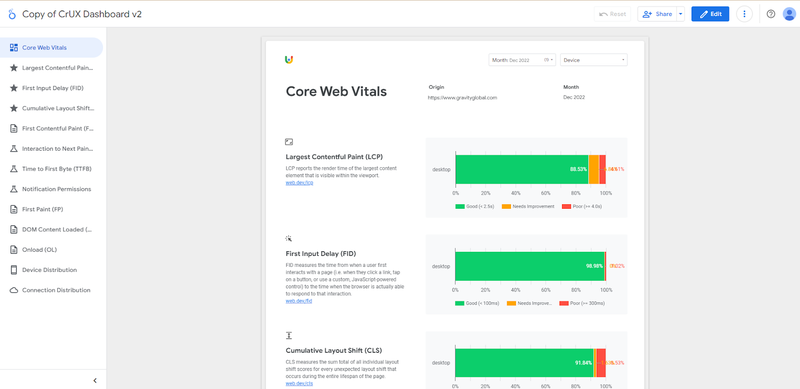
CrUX Dashboard is a dashboard that displays user experience metrics information of a particular website based on data from CrUX. It has 13 reports, including an overview of the site’s CWV. The other reports provide information on diverse user experience metrics, such as First Contentful Paint and Time to First Byte.
This dashboard will help you to gather useful insights about different user experience metrics and their trends.
How to set up a CrUX Dashboard step by step
- Visit the CrUX Dashboard template URL and provide authorisation to Google.
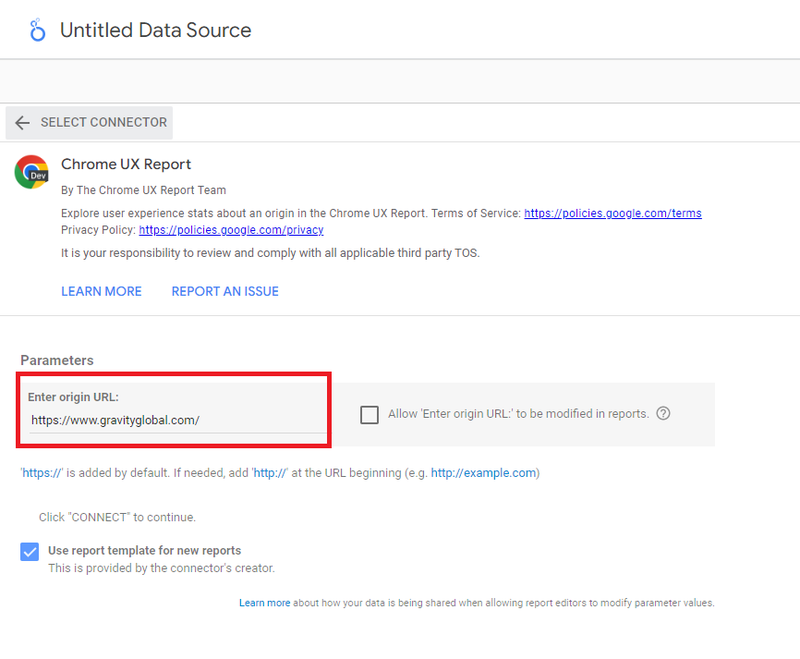
- Enter the origin URL i.e. the website you want to analyse. Note that it doesn’t work with specific pages of a site, only the domain.
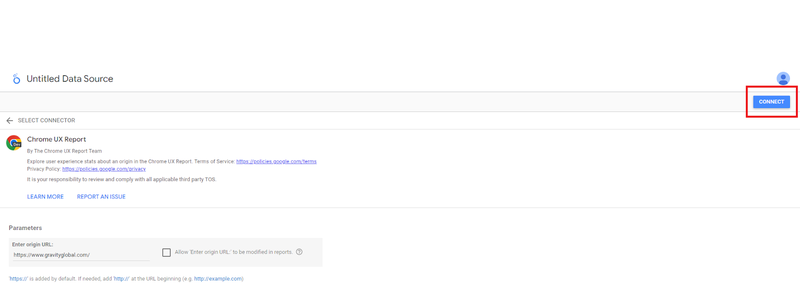
- Click the “Connect” button in the top right of the screen.
- The schema page will then open. This displays all the parameters included in the data set that the dashboard will use to generate your report. You don’t need to update or configure anything at this point.
.png?w=800)
- Finally, click on “Create report”. You will now see the dashboard with a number of reports about different page experience metrics.
And with that, you have a dashboard that you can use to explore and analyse the user experience metrics of your website. If you would like support with a Technical SEO audit or how to use data to implement a meaningful performance marketing strategy, we’re here to help.
Get in touch to learn more about our SEO expertise and services.


.jpeg)